spectraNET

Your network, alive.

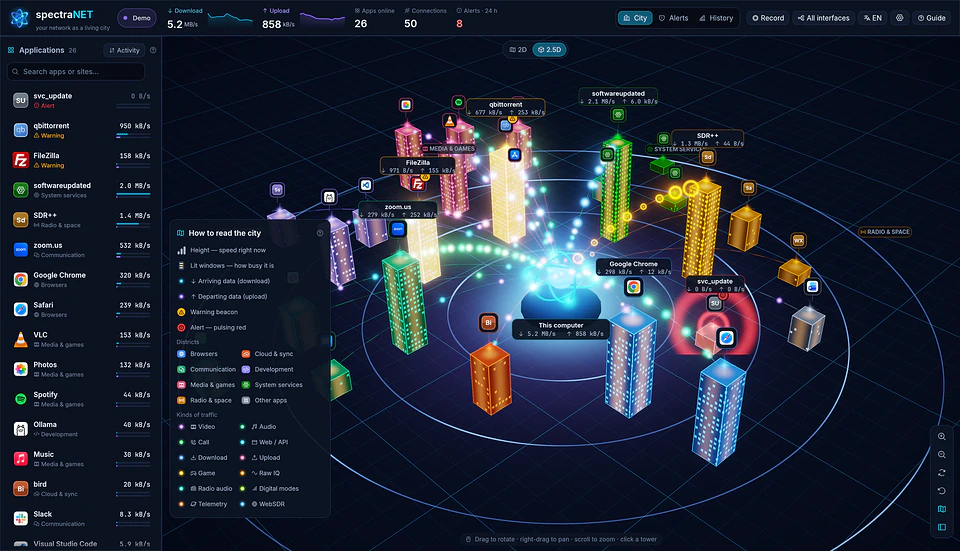
spectraNET measures every connection of every program and draws it as an animated 2.5D city, or as a 2D map: see which apps use the network, how much, with whom, and whether anything looks suspicious.

Version 1.1.0 macOS, Windows, Linux Free

Real screenshot of spectraNET

Every app you open talks to someone. spectraNET tells you who, how much and why, in plain words, in a 2.5D city you can explore or a 2D map seen from above. It reads the kernel's own counters, recognises video, calls and downloads without decrypting anything, and warns you when a program contacts a server known to be malicious. All of it measured locally, on macOS, Windows and Linux: the app, the snet command line and the snetd service.

Your network, alive.

The per-application network monitor.

In the terminal, too.

snet brings the same measurement as the app, in the tradition of top, nettop and ntop, with man pages and JSON output.

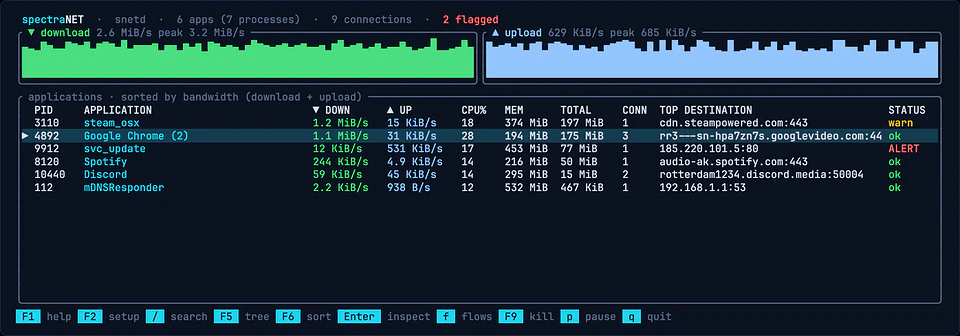
  1. snet top

    Real output of snet top

    Full-screen view: graphs, sortable table, details.

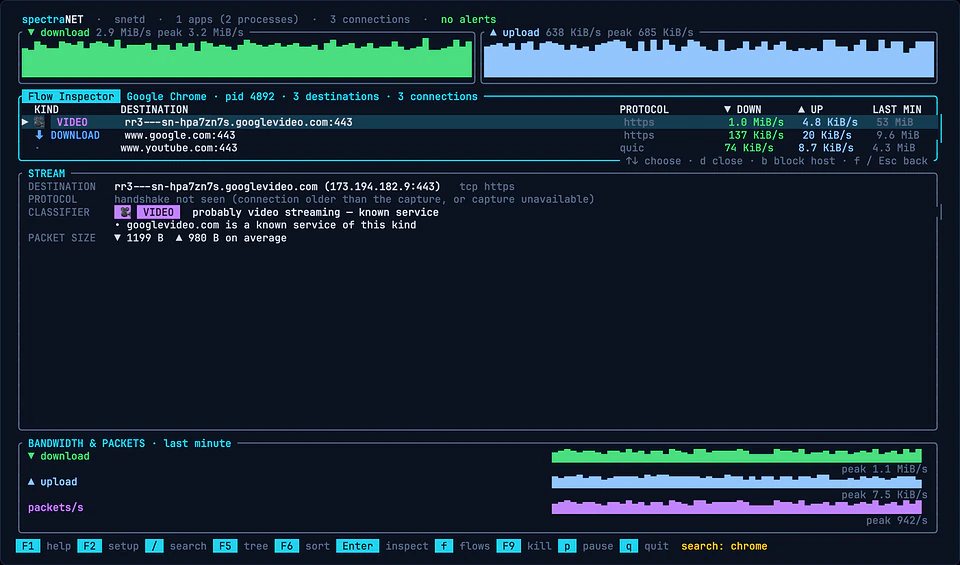
  2. snet top → f

    Real output of snet top  →  f

    Press f: the Flow Inspector, one row per destination with kind, TLS and JA4.

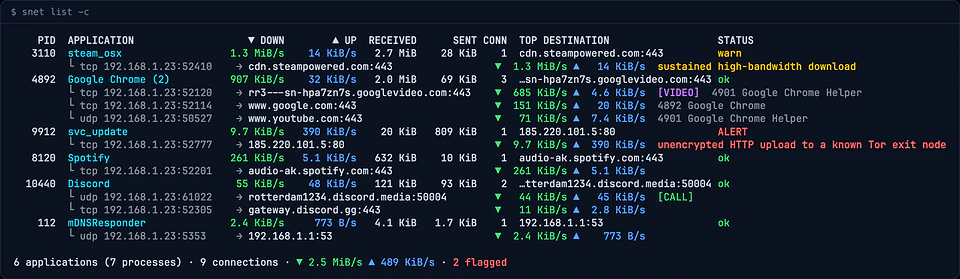
  3. snet list -c

    Real output of snet list -c

    Applications with their active connections.

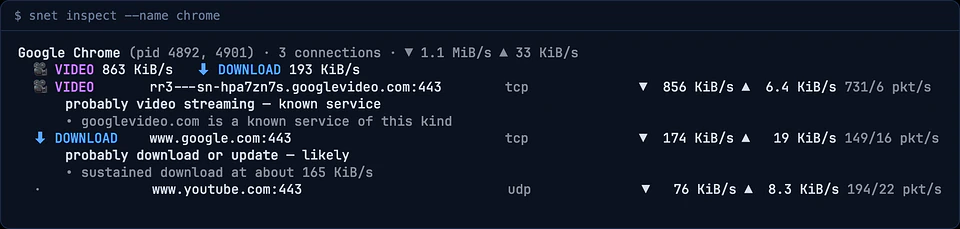
  4. snet inspect --name chrome

    Real output of snet inspect --name chrome

    An application's network profile: kinds, protocols, TLS.

  5. snet stream

    Real output of snet stream

    What each connection carries, as it is recognised.

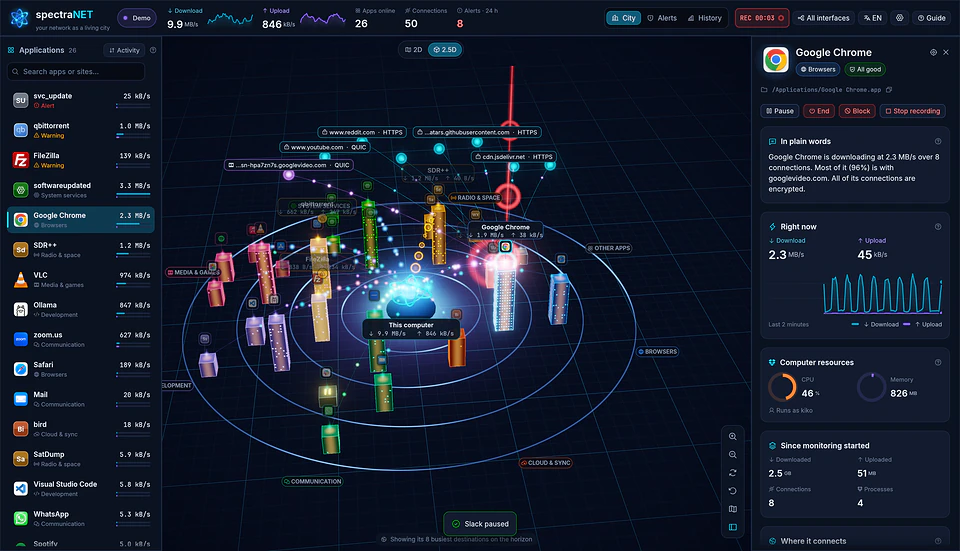
Every app is a tower.

This computer sits at the centre. Around it, one tower per application, topped by its real icon: height is its speed right now, lit windows show how busy it is.

  • Districts by kind: browsers, cloud, communication, development, media and games, system services
  • Particles of light: cyan for download, violet for upload
  • An amber beacon asks for a look, a pulsing red one is an alert
Every app is a tower.

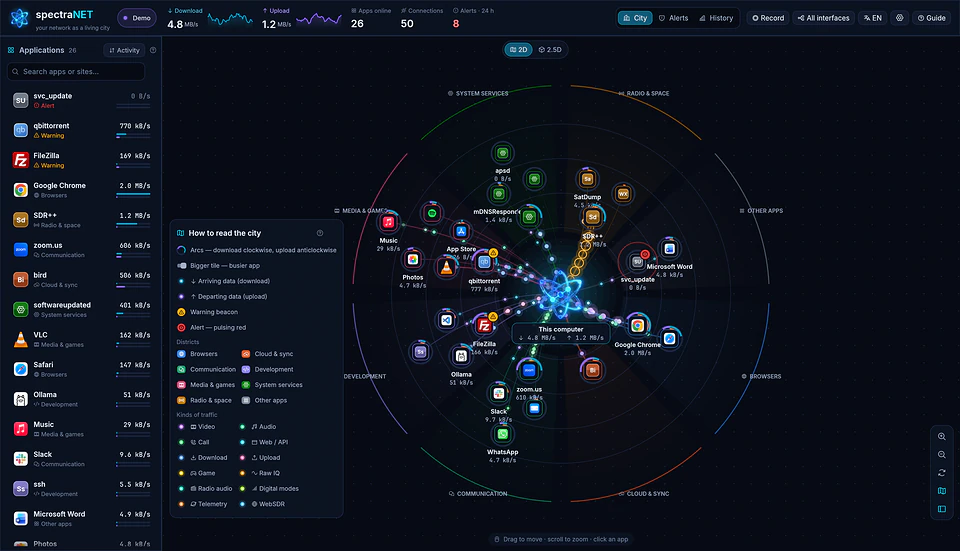
Also in 2D, like a map.

With the 2D | 2.5D switch, or the V key, you see the city from above. Every app is a tile with its icon inside a gauge: the arc running clockwise is its download, the one running anticlockwise its upload.

  • Logarithmic: a half-turn is about 100 MB/s
  • Bigger tiles are busier apps
  • Particles flow along the links exactly as in 2.5D
  • Drag to move, scroll to zoom, click an app to inspect it
Also in 2D, like a map.

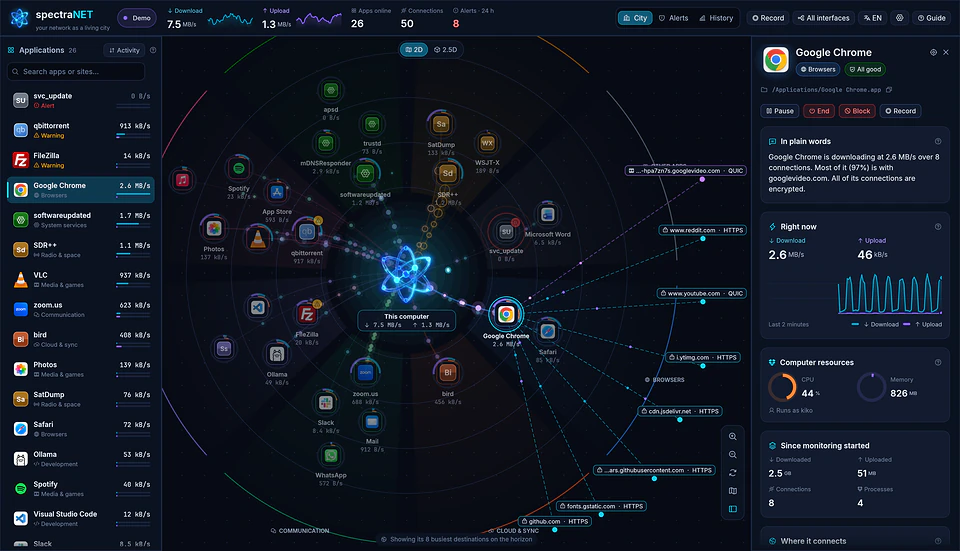
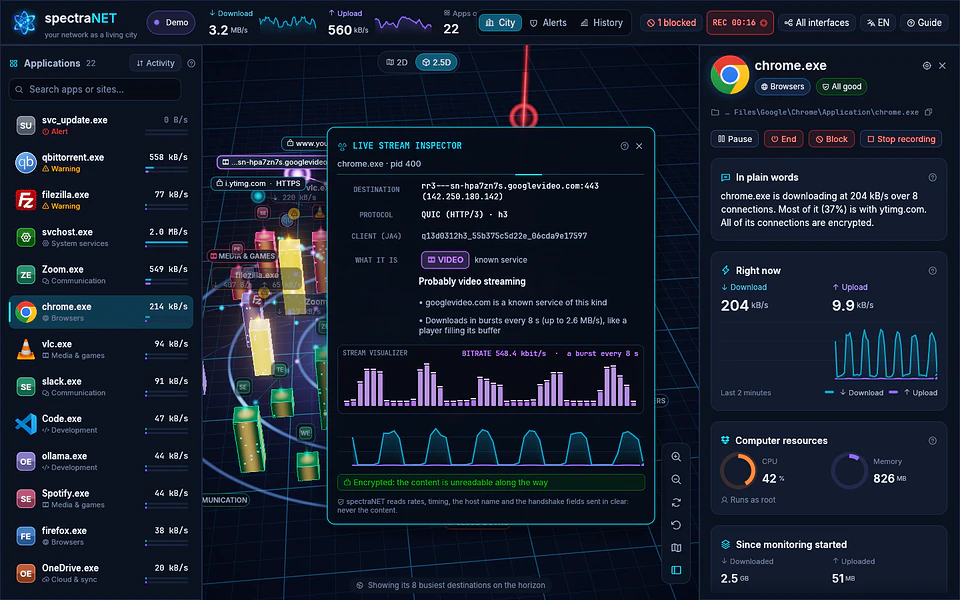
Click an app. Understand it.

The camera frames the app, its destinations rise on the horizon and the inspector opens: what it is doing right now, in plain words, and who it is talking to.

  • Every destination with its hostname, learned without decrypting anything
  • A padlock per connection: closed is encrypted, open is readable along the way
  • Two minutes of download and upload, totals and processes
Click an app. Understand it.

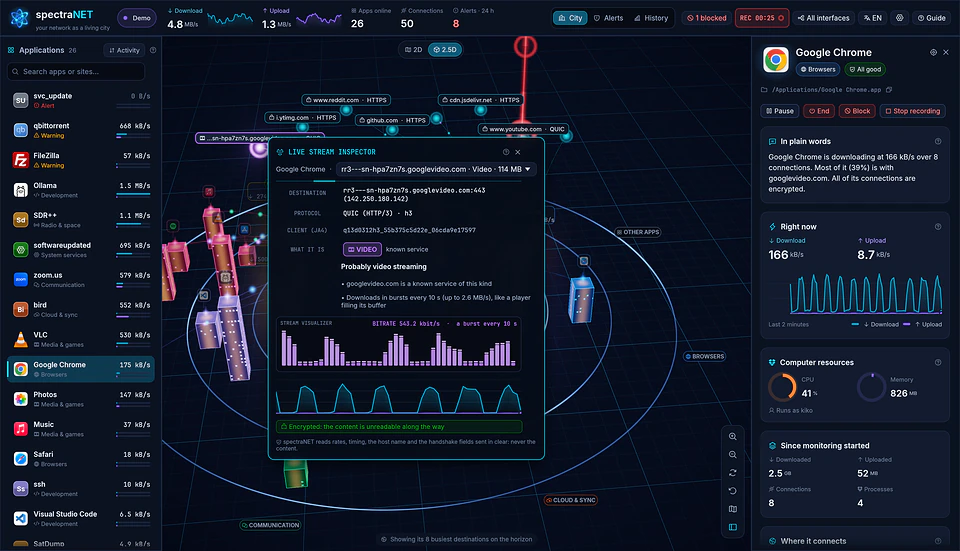
What kind of traffic it is.

Video, music, a call, web pages, a download or a game: spectraNET recognises it from the host, the pattern over the last half minute and the handshake sent in clear. Without reading the content.

  • It says how sure it is, likely, very likely or known service, and why
  • TLS version, offered protocols and JA4 fingerprint
  • The stream inspector shows a live visualizer for each kind
What kind of traffic it is.

Pause, end, block.

Right-click a tower: pause an app, end it, close a single connection, or cut it off the network for 15 minutes, an hour, a day or until you unblock it.

  • Every action is confirmed and written to the audit log
  • It never touches protected system processes, the gateway, the DNS servers or a remote session
  • The Flight Recorder captures an app's traffic to study with snet analyze
Pause, end, block.

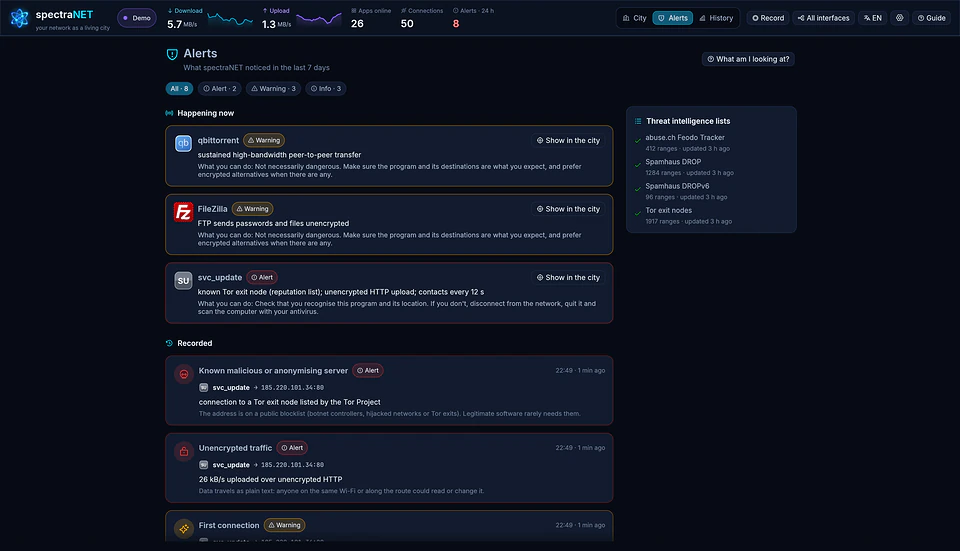
Alerts that explain.

Every alert says what happened, to which app and address, why it matters and what to do. The last 7 days stay on record, filterable by severity.

  • Malicious or anonymising servers: Feodo Tracker, Spamhaus DROP and Tor exits, refreshed every 12 hours
  • Unencrypted traffic to the internet: HTTP, FTP, Telnet
  • A program's first connection to a new destination
Alerts that explain.

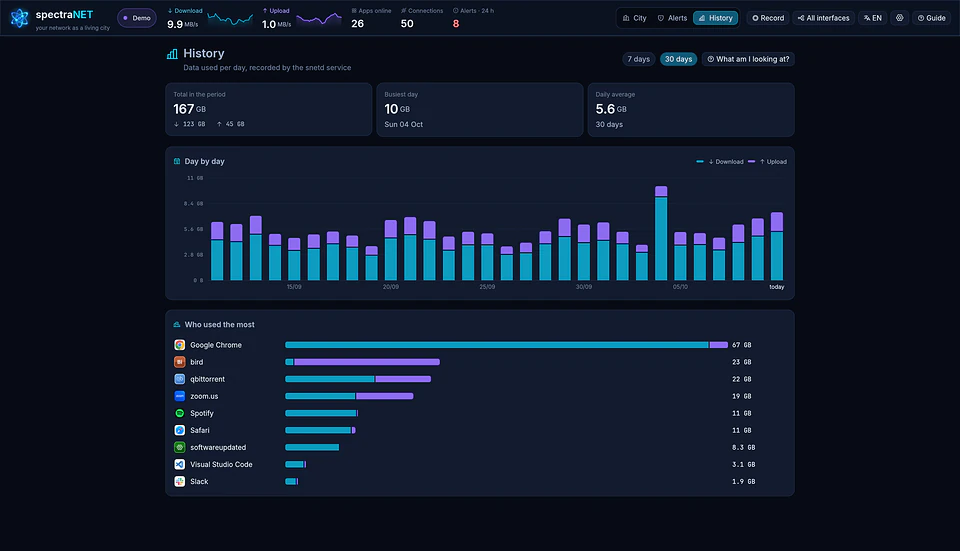
History, even when the app is closed.

The snetd service counts every byte per application and per day. The last 7 or 30 days in one chart: total, busiest day, daily average and the apps that used the most.

  • Everything stored locally, in the service's database
  • Prometheus metrics on request, for Grafana and friends
History, even when the app is closed.

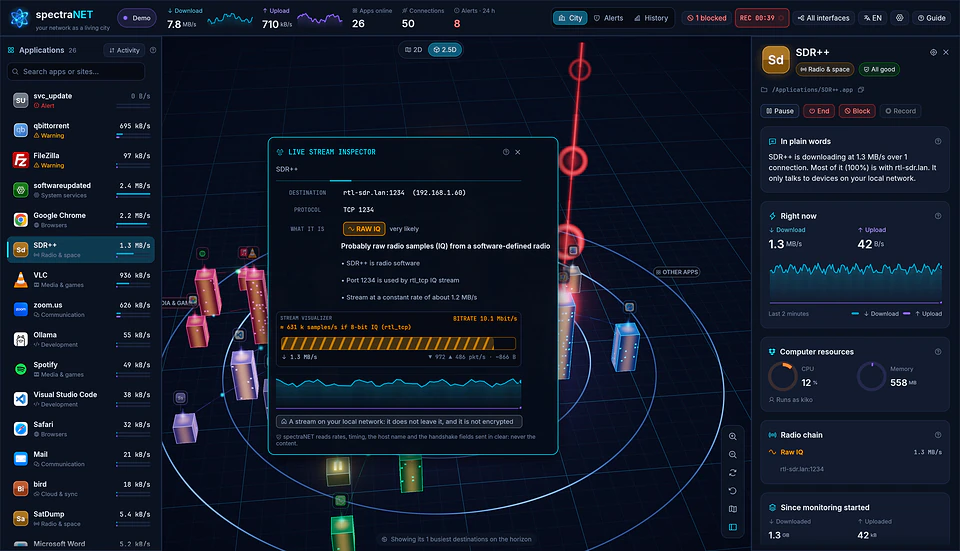
Radio and satellites.

spectraNET knows software-defined radio: receivers like SDR++ and GQRX, servers like rtl_tcp, decoders like SatDump and dump1090 get a district of their own, Radio & space.

  • Raw IQ, radio audio, digital modes, telemetry and WebSDR recognised
  • The radio chain shows what an app feeds or receives
  • No sample, audio or image is ever read
Radio and satellites.

On every system. With the right numbers.

The same city on macOS, Windows and Linux, each with its native graphics API. The numbers are the ones the kernel already keeps for every connection, not a guess from sniffed packets.

  • NetworkStatistics on macOS, eBPF on Linux, Event Tracing on Windows
  • Metal, DirectX 12, Vulkan or OpenGL: about 2 ms per frame on an Apple M1 Max
  • In byte-for-byte tests, a 200 MB download is measured exactly on all three systems
  • Five languages: English, Italian, French, German and Spanish
On every system. With the right numbers.

At a glance

Systems
macOS 11+ (Apple silicon and Intel), Windows 10/11 x64, Linux x86-64 (kernel 5.8+ with BTF)
Three tools
spectranet desktop app, snet command line, snetd background service
Measurement
NetworkStatistics on macOS, eBPF on Linux, Event Tracing for Windows
Views
Animated 2.5D city and 2D map, own 3D renderer (Metal, DirectX 12, Vulkan, OpenGL)
Traffic kind
Known hosts, flow pattern, TLS handshake and JA4 fingerprint
Alerts
Feodo Tracker, Spamhaus DROP/DROPv6, Tor exits, cleartext traffic, first connections
Actions
Pause, end, close connection, timed block, Flight Recorder
Integrations
Prometheus metrics, JSON output, man pages, shell completions
Languages
English, Italian, French, German, Spanish
Privacy
Everything local: traffic is never decrypted or uploaded
License
Free app; snet and snetd open source, MIT or Apache-2.0

Get spectraNET.

Pick the file for your system. Every download comes straight from the official releases on GitHub.

macOS

Open the DMG and drag spectraNET to Applications. The first time: right-click → Open, then Install service from the bar at the top.

Unpack the archive and run sudo ./snetd install: it installs the service, snet and the man pages.

Windows

Run the installer, in English or Italian: it installs the app and the service and can put snet on the PATH. No Run as administrator needed.

Unpack the archive; from an administrator PowerShell, .\snetd.exe install installs the service.

Linux

Make it executable and run it; sudo ./spectraNET-….AppImage snetd install adds the service. The same file runs snet.

sudo apt install ./spectranet_<version>_amd64.deb, then sudo snetd install for the systemd service.

Unpack the archive under /usr/local.

Release notes on GitHub

Requirements

macOS 11 or later (Apple silicon and Intel), Windows 10/11 x64, Linux x86-64 with kernel 5.8+ and BTF (every current distribution).

License

Free. The snet command line and the snetd service are open source, under your choice of MIT or Apache-2.0.

Questions and answers

Is spectraNET free?

Yes. The desktop app is free to download and use. The snet command line and the snetd service are open source, under your choice of MIT or Apache-2.0.

Does spectraNET read or decrypt my traffic?

No. Everything is measured locally, and nothing is decrypted or uploaded. Hostnames come from DNS answers and the parts of TLS and QUIC handshakes sent in clear. The only things it downloads are public lists of malicious servers.

How do I see which apps are using the internet?

Open spectraNET: every tower in the city is an application using the network, and the taller it is, the more it is downloading or uploading right now. In a terminal, snet list shows the same apps, busiest first.

Does spectraNET have a 2D view?

Yes. The 2D | 2.5D switch at the top of the city, or the V key, shows the same districts from above: every app is a tile with its icon inside a gauge, download running clockwise and upload anticlockwise. Bigger tiles are busier apps.

What is the snetd service for?

It measures continuously, learns more hostnames, keeps the history, raises alerts and carries out actions such as blocking. Without it the app still works, with fewer hostnames and no history or alerts. To just look around, run spectranet --demo.

Can I use it from the terminal only?

Yes. snet follows the tradition of top, nettop and ntop: snet top for the full-screen view, snet stream for the kind of traffic, snet inspect for a process's profile, with JSON output and a man page for every command.

Can it block an application?

Yes, for 15 minutes, an hour, a day or until you unblock it. Linux and Windows block the program at once; macOS blocks the addresses the app uses as soon as they are seen. Blocks live in the service: remove it and they vanish, so nothing stays blocked by accident.

macOS shows a warning on first launch. Is that normal?

Yes. The app is not notarised by Apple yet: the first time, right-click spectraNET and choose Open. You only need to do it once.

How accurate are the numbers?

spectraNET reads the byte counters the kernel already keeps for every connection, and every second compares them with the network adapters' own counters. In the tests published in the README, downloads, uploads and short connections come out exact on macOS, Linux and Windows.

Is spectraNET useful to you?

spectraNET is free, and its command line and service are open source. If it showed you who uses your network, you can support its development: donations pay for code signing, test machines for the three systems and time for new features.

Next app: Vocalis The MIDI and KAR karaoke player built for live nights.